What a cycle count is and how it differs from a physical inventory
A physical inventory counts everything in the warehouse on one date, usually at fiscal year-end, and often requires stopping receiving and shipping for one or more days. A cycle count counts a small part of the warehouse every day or every week, on a schedule that ensures each product is checked several times a year.
The practical difference is not only the size of the count. In an annual inventory, a discrepancy that originated in March is discovered in December, when the events can no longer be reconstructed and the stock ledger has months of later movements. In a cycle count, the same discrepancy appears weeks later and can be traced to the receipt, put-away or pick that caused it.
The two methods are not mutually exclusive. Many companies keep an annual physical inventory for accounting or tax reasons and use cycle counting to maintain accuracy for the rest of the year. With a mature cycle count program, the annual inventory becomes a confirmation rather than a search for accumulated discrepancies.
Why counting in cycles pays off
- The warehouse keeps operating. One zone, a few aisles or a list of locations is counted; the rest of the warehouse receives and picks as usual.
- Discrepancies are investigated in time. A recent discrepancy has few movements to review in the stock ledger and a cause that can still be corrected.
- The effort is spread out. Instead of a weekend with the entire staff, the count takes part of the shift of one or two people.
- Accuracy is measured continuously. Each count produces an accuracy figure; with several months of data, the warehouse can see whether a new control improved the operation.
How to classify products with ABC analysis
ABC analysis ranks products by their importance to the operation and assigns a count frequency to each group. The most common criterion is annual usage value: the units shipped in the year multiplied by their unit cost.
- Calculate the usage value of each product for the last 12 months.
- Sort the products from highest to lowest value.
- Calculate the cumulative percentage of the total value.
- Assign the class: A for the products that make up approximately the first 80% of the value, B for the next 15% and C for the rest.
The 80, 15 and 5 percentages are a reference convention, not a rule. Adjust them to your operation. In addition to value, products with a high risk of discrepancy should move up a class even if their value is low: small parts that are easily confused, products with several units of measure, items with a history of shortages or goods tracked by lot and expiration date.
| Class | Typical products | Reference frequency | Counts per year |
|---|---|---|---|
| A | A few products with most of the value or the risk | Every 30 days | 12 |
| B | Products with intermediate value and turnover | Every 90 days | 4 |
| C | Most products, with low value or little movement | Every 180 days | 2 |
How many locations to count each day
With the classes and their frequencies, the daily workload is a simple division. Consider a warehouse with 300 A products counted every 30 days, 700 B products every 90 days and 2,000 C products every 180 days, and 22 working days per month:
- Class A: 300 products × 12 counts per year = 3,600 counts.
- Class B: 700 × 4 = 2,800 counts.
- Class C: 2,000 × 2 = 4,000 counts.
- Total: 10,400 counts per year, about 39 per working day (10,400 ÷ 264).
If a product occupies several locations, the actual workload is measured in locations, not products.
How to implement a cycle count program
- Organize the locations first. Each location needs a unique code and a scannable label. Without reliable locations, a count shows how much stock there is, but not where; see the guide on location naming.
- Classify the products with ABC analysis and agree on the frequency of each class with the person accountable for inventory.
- Define the scope of each count: a zone, some aisles, some levels or a list of locations. Counting by location is faster than searching for a product throughout the warehouse.
- Choose the time. Count when the area has little activity, for example at the start of the shift or after the last shipping cutoff, so that goods are not moved during the count.
- Assign sections to people other than those who receive and pick in that zone, when staffing allows. Separating duties reduces the risk that a discrepancy is corrected without investigation.
- Count with scanning: first the location, then each product with its quantity, lot or serial number.
- Investigate discrepancies before adjusting: count again, review the stock ledger and look for the product in nearby locations.
- Adjust with a reason and approval. A person with authority reviews and applies the adjustment; the reason is recorded.
- Measure accuracy every month with the same criterion and review the most frequent causes of adjustments.
What to do with discrepancies
Not every discrepancy is a loss. Before adjusting, separate the results:
- Match: the counted quantity equals the recorded quantity.
- Wrong location: the product is present, but in another location. It is corrected with a transfer, not an adjustment.
- Overage: physical stock is higher than recorded; this is often a receipt recorded short or an unrecorded return.
- Shortage: physical stock is lower than recorded; the cause can be a pick from another location, unrecorded shrinkage or a receipt recorded over.
- Not in system: there is product in a location where it was not recorded.
A shortage in one location and an overage of the same product in another are usually a single put-away or picking error. The guide on inventory discrepancies details how each cause is detected and the control that prevents it.
How to measure inventory accuracy
The most widely used measure is accuracy by location, known as inventory record accuracy (IRA): the percentage of counted locations whose quantity matches the record.
Inventory accuracy = locations counted without a discrepancy ÷ locations counted × 100
If 850 locations were counted in a month and 816 matched, accuracy was 96%. Some companies accept a tolerance by class (for example, no discrepancy in A and a small one in C). If you use one, state it and do not change it from one month to the next, because the figure stops being comparable. The guide on warehouse KPIs explains this and other measures.
Common mistakes when starting
- Adjusting without investigating. The inventory is correct that day, and the cause continues to produce discrepancies.
- Counting while picking. A location that is picked during the count shows a discrepancy that does not exist.
- Always counting the same products. If the schedule does not cover class C, its discrepancies accumulate until the annual inventory.
- Measuring with changing criteria. An accuracy figure calculated differently each month cannot be compared.
- Leaving documents open. Receipts not yet closed and transfers in transit explain many apparent discrepancies; review them before the count.
How Chainlink WMS handles it
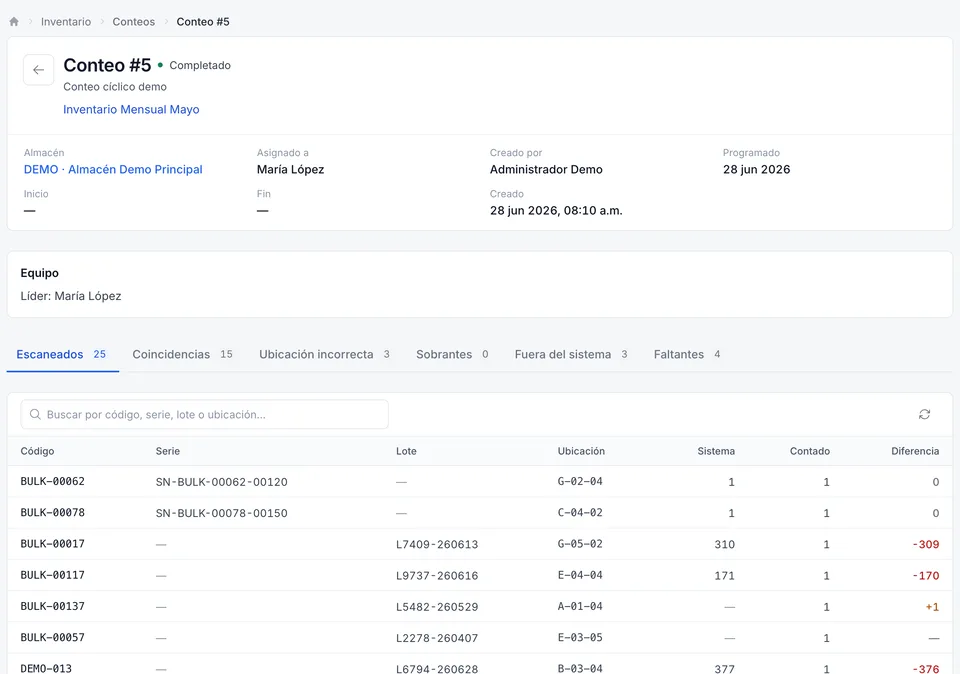
In Chainlink, a count is created in Inventory › Counts › New for a zone, some aisles, some levels or a list of locations. It is divided into sections, and each section appears in the app of the assigned operator. On the handheld, the operator scans the location and then each product with its quantity or serial number; the count works fully without a signal and is sent when the connection returns.
On closing, Chainlink separates matches, wrong locations, overages, shortages and products not in the system, and adjustments are applied by a user with an Administrative license. Each adjustment is posted to the stock ledger with its document and user; with an ERP connector, the adjustment is also sent to the ERP. In Professional and Enterprise, advanced analytics calculates inventory accuracy from the locations counted without a discrepancy, and an RFID count reads a complete section without scanning item by item. See counts and RFID inventory.
Frequently asked questions
Does cycle counting replace the annual physical inventory?
That depends on what your accountant and your auditor require. Cycle counting maintains accuracy during the year; many companies keep a physical inventory at fiscal year-end for accounting or tax reasons, and with a cycle count program that inventory finds fewer discrepancies.
How often is each product counted?
A common reference is every 30 days for class A, every 90 for class B and every 180 for class C. The correct frequency is the one your team can meet every day without leaving any class uncounted.
Who should apply the adjustments?
A person with authority over the inventory, other than the person who counted whenever possible. The person who counts records what was found; the person who adjusts reviews the discrepancy, investigates the cause and records the reason.