Why to measure a few well-defined indicators
A warehouse can measure dozens of variables. The risk is a dashboard with twenty figures that are not reviewed or that each department calculates differently. An indicator is useful when it meets four conditions:
- A written formula. What is counted, what is divided and over which period. «Inventory accuracy» without a formula means different things to the warehouse, to finance and to the auditor.
- Data recorded automatically. If the data depends on manual entry at the end of the shift, the indicator measures data-entry discipline, not the process.
- An owner. A designated person reviews the figure every week or every month and decides what action to take when it changes.
- A possible action. If no owner can change the result, the indicator is informational, not a management tool.
The main indicators and their formulas
| Indicator | Formula | What it reveals |
|---|---|---|
| Inventory accuracy | Locations counted without a discrepancy ÷ locations counted × 100 | Whether the record reflects what is in each location |
| Picking accuracy | Lines picked without an error ÷ lines picked × 100 | Product, lot or quantity errors in picking |
| On-time in-full orders (OTIF) | Orders delivered complete and on the committed date ÷ orders delivered × 100 | The service the customer experiences |
| Line fill rate | Lines picked complete ÷ lines ordered × 100 | Stock or allocation shortages |
| Dock-to-stock time | Time from the receipt of a line until it is put away | How long goods take to become available |
| Order cycle time | Time from order release to dispatch, by phase | The phase in which orders stall |
| Lines per hour | Lines picked ÷ active picking hours | Productivity of the picking process |
| Receiving discrepancies | Lines received with a difference against the document ÷ lines received × 100 | Quality of supplier shipments and of data capture |
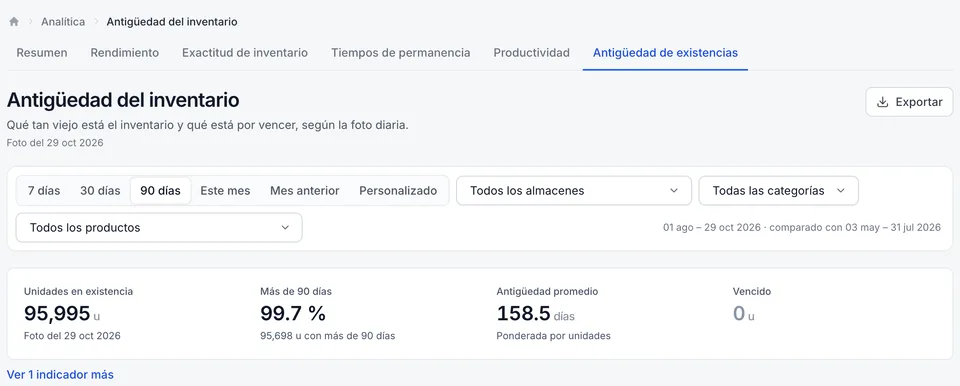
| Inventory aging | Units by range of days in the warehouse or days to expiration | Stagnant goods and the risk of expiration losses |
Inventory accuracy: the foundation indicator
Every other indicator depends on a correct record. If the system shows 48 units in a location and physical stock is 44, picking fails, the commitment to the customer fails and purchasing is calculated incorrectly.
Accuracy is measured with count results. For example, if 850 locations were counted in a month and 816 matched, accuracy was 96%. Three decisions should be made before measuring:
- By location or by product. By location is stricter: a product with the correct total quantity but in another location counts as a discrepancy.
- With or without tolerance. Some companies accept a small difference on low-value products. If you use a tolerance, write it down by product class.
- With which sample. The accuracy of a month in which only A products were counted is not comparable with that of a month in which everything was counted.
The guide on cycle counting explains how to organize the counts that feed this indicator.
Service indicators: the service the customer experiences
On-time in-full orders combines two conditions: the order ships complete, and it ships on the committed date. It is the indicator closest to the customer's experience and also the most demanding, because an order with a single incomplete line counts as a failure.
Line fill rate isolates the problem: if the line fill rate is high and few orders ship complete, the shortages are concentrated in a few products that appear in many orders. A review of shortages by product shows whether the problem is stock, allocation or location.
To compare periods, define what counts as «on time»: the warehouse dispatch date or the customer delivery date. They are different indicators and should not be mixed.
Speed indicators: where goods stall
Dock-to-stock time. Measures how long received goods take to be put away and become available for picking. A long time usually indicates put-away in batches at the end of the shift, a shortage of receiving staff or locations without space. Report the median and the 90th percentile: the median describes a typical day; the 90th percentile, the wait of the slowest cases.
Order cycle time by phase. Dividing the total time into phases (release, picking, packing, shipping) shows the phase in which orders accumulate. A long cycle with fast picking points to packing or to the wait for the carrier.
Productivity indicators: measuring the process
Lines per hour is the most common measure of picking productivity. It is calculated with active hours, not paid hours, so that a wait caused by a lack of orders does not appear as low operator productivity.
This indicator should be read by process and by zone, not as a ranking of people. A zone with fewer lines per hour can have heavy products, long routes or high locations; comparing it with another zone without that context leads to incorrect conclusions.
How to implement a KPI dashboard
- Select five indicators from the table according to your current problems.
- Write the formula of each one, with the period and the exclusions.
- Confirm the data source: each data point must come from an operational record (scan, document, count), not from later data entry.
- Measure for four weeks without targets to establish the baseline.
- Set targets from that baseline and review the indicators every week with the people who can act on them.
- Add indicators only when the first ones are reviewed consistently.
How Chainlink WMS measures them
In every plan, the Chainlink dashboard shows the day's pending work: pending receipts, units awaiting put-away, picks in progress, the day's shortages, low stock and open counts, and each indicator opens its filtered list.
In Professional and Enterprise, advanced analytics adds six dashboards with warehouse, date and process filters: overview, units picked per hour, inventory accuracy (with picking accuracy and receiving discrepancies), dock-to-stock time with the median and the 90th percentile, order cycle time by phase, productivity by operator and inventory aging by age range and by expiration range. The figures are updated every 15 minutes and export to XLSX with the same rows as the screen. The data comes from handheld scans and documents, not from later data entry. See picking, counts and pricing by plan.
Frequently asked questions
What is the most important warehouse indicator?
Inventory accuracy, because the other indicators depend on it. If the record does not match what is in the locations, picking, customer service and purchasing fail even when the team works well.
How often should the indicators be reviewed?
Daily operating indicators (shortages, pending receipts, picks in progress) every day; accuracy, service and productivity indicators every week, with a monthly summary for management.
Can productivity be measured without floor scanning?
Only approximately. Without a record of when each task starts and ends, productivity is calculated with paid hours and closed documents, and it does not separate waiting time from working time.